Your Infrastructure, Simplified

Explore a world of possibilities! Unleash the features that transform data into decisions.

01

03

Illustration of a map depicting a secure cropping of the project area
Illustration depicting the configuration of various project parameters, including sensors, alerts, etc.
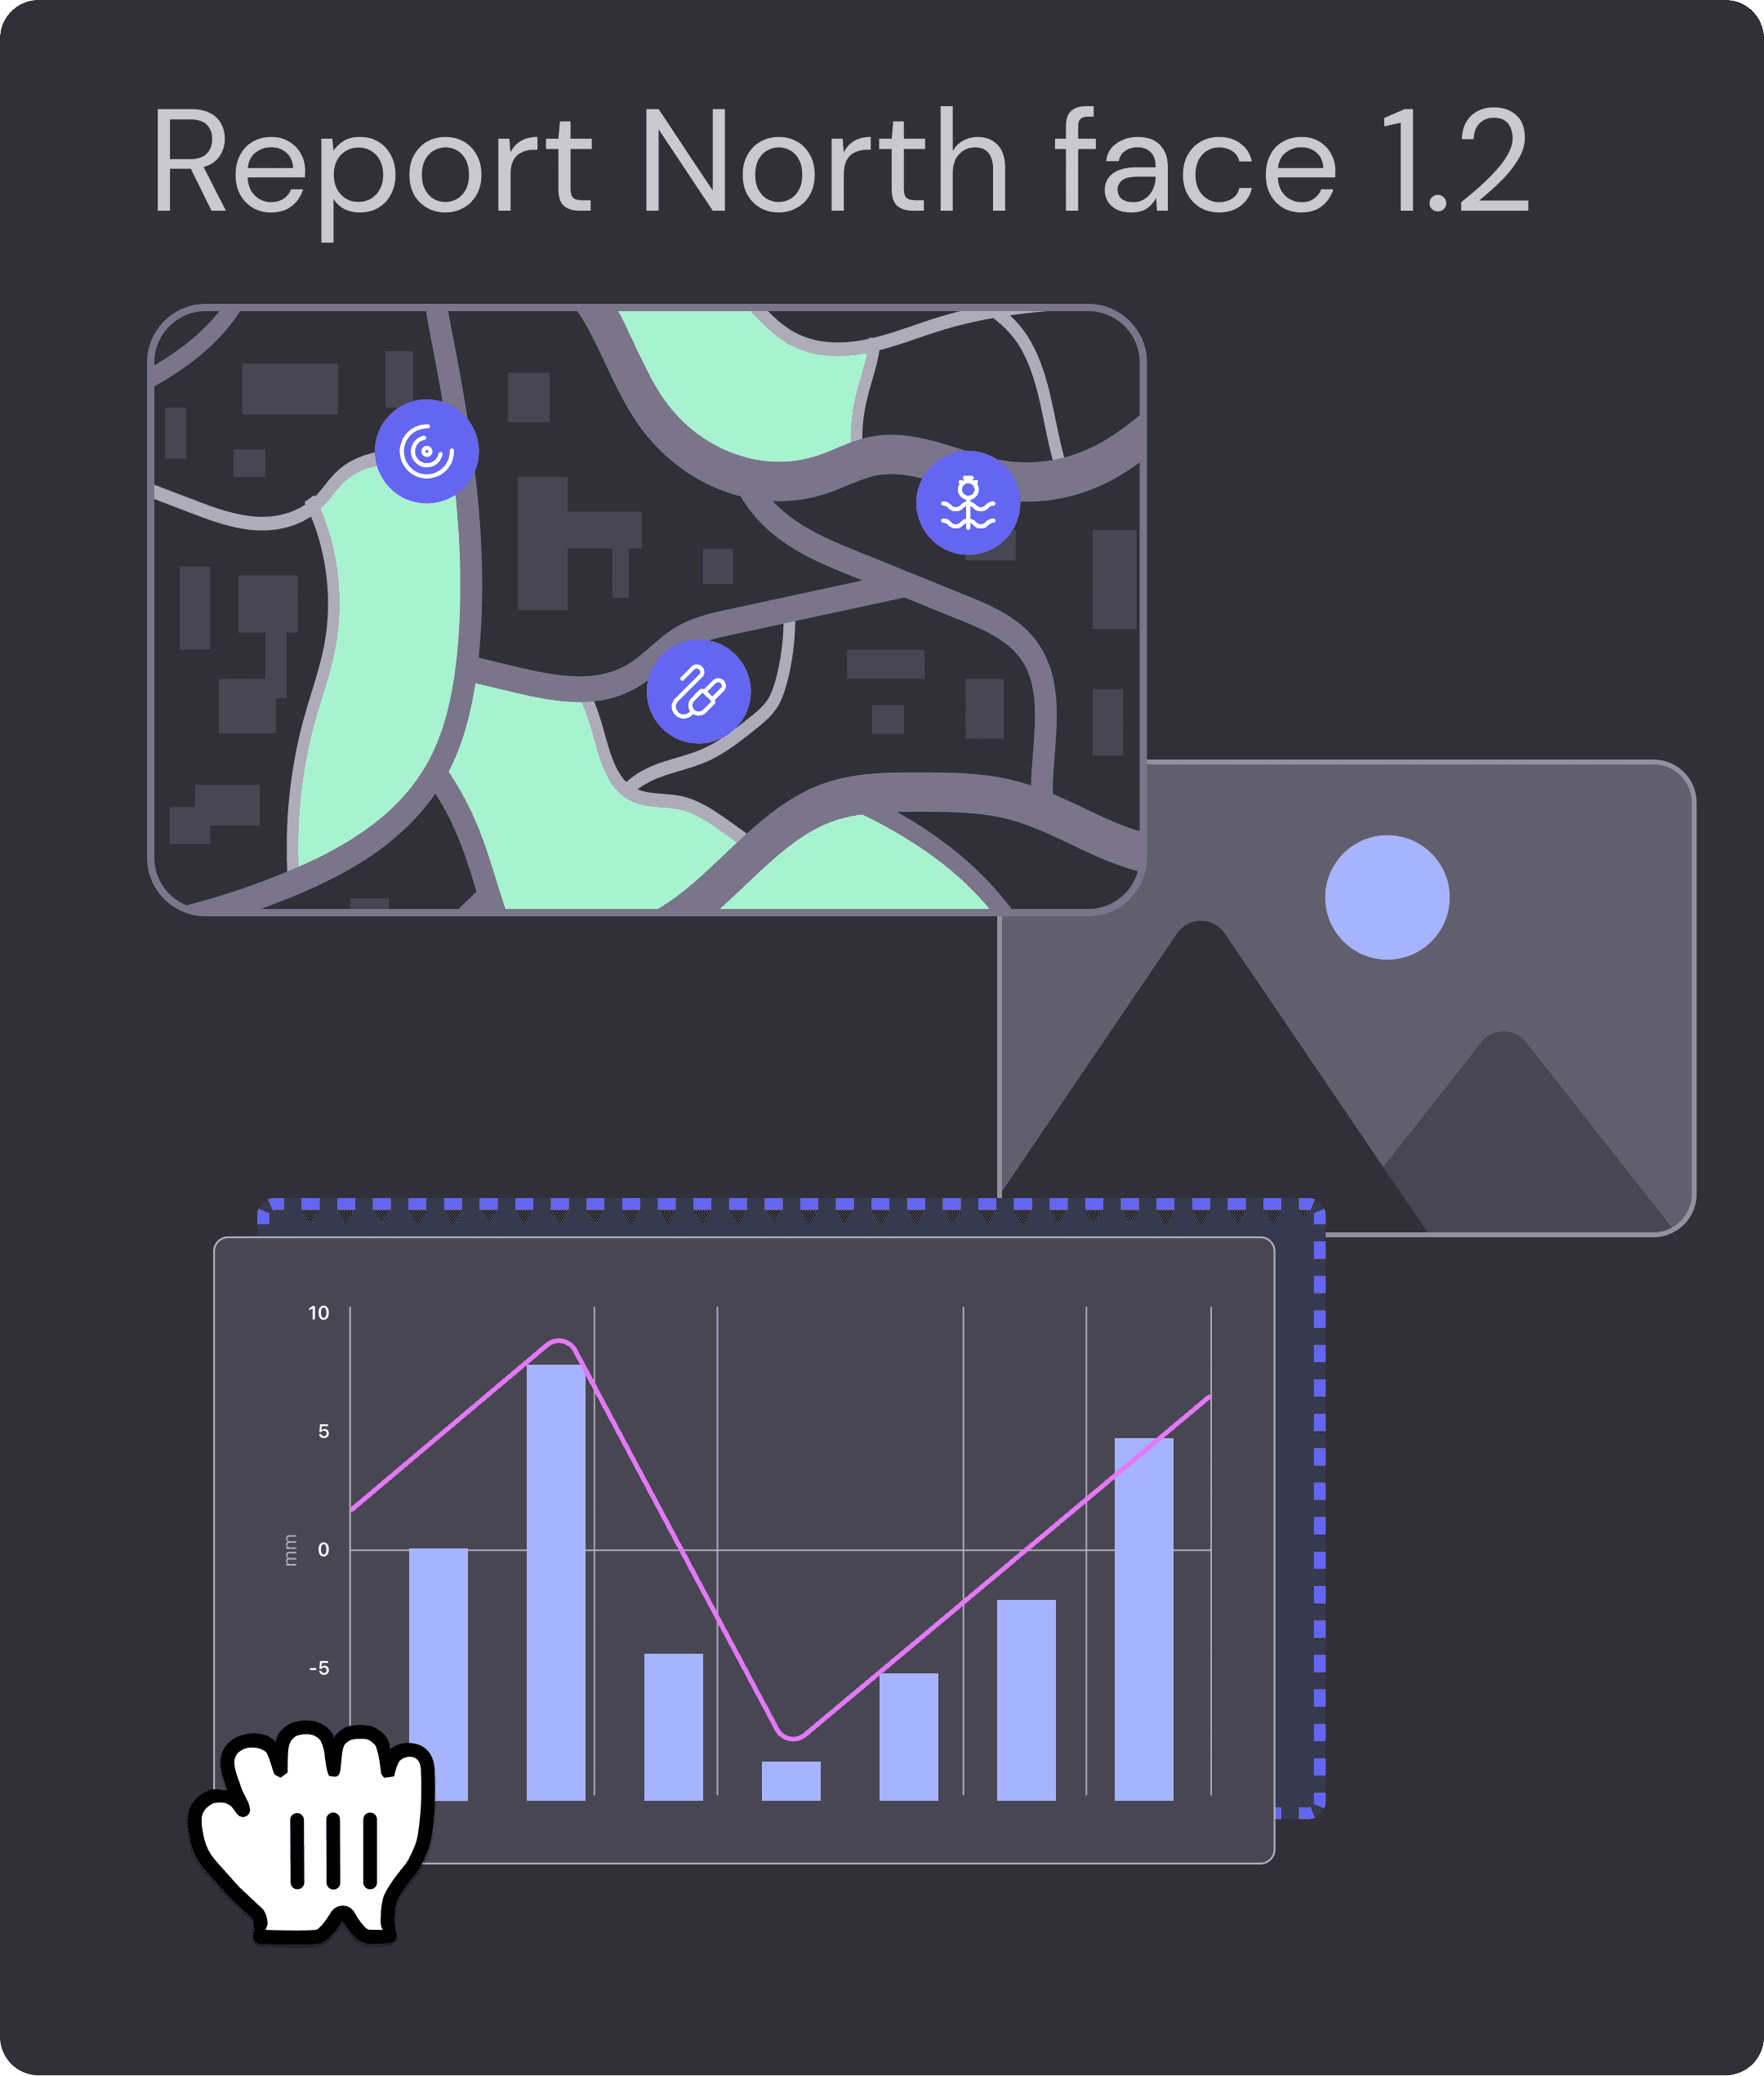
Illustration demonstrating the ability to customize reports with a drag-and-drop interface.
Illustration signaling that everything is okay, featuring various representative icons and a hand making the 'OK' gesture.

1

We create your own secure and scalable environment

We initiate your journey by establishing a personalized, secure, scalable environment tailored to your needs. Your data deserves a space that ensures security and allows seamless scalability as your requirements evolve.

Illustration of a map depicting a secure cropping of the project area
Illustration depicting the configuration of various project parameters, including sensors, alerts, etc.
Illustration demonstrating the ability to customize reports with a drag-and-drop interface.
Illustration signaling that everything is okay, featuring various representative icons and a hand making the 'OK' gesture.

2

Configure data, instruments, model constructions, etc. Alerts included!

Take control as you effortlessly configure your data, instruments, and model constructions. Our 24/7 support is by your side, ensuring you're never alone in this process. Yes, alerts are part of the package – keeping you informed and in control.

Illustration of a map depicting a secure cropping of the project area
Illustration depicting the configuration of various project parameters, including sensors, alerts, etc.
Illustration demonstrating the ability to customize reports with a drag-and-drop interface.
Illustration signaling that everything is okay, featuring various representative icons and a hand making the 'OK' gesture.

3

Customize your dashboard and reports

Make it yours! Personalize your dashboard to reflect the insights that matter most to you. Whether it's key performance indicators or specific data points, customization is at your fingertips. Craft reports that align with your goals and present information in a way that makes the most sense for you.

Illustration of a map depicting a secure cropping of the project area
Illustration depicting the configuration of various project parameters, including sensors, alerts, etc.
Illustration demonstrating the ability to customize reports with a drag-and-drop interface.
Illustration signaling that everything is okay, featuring various representative icons and a hand making the 'OK' gesture.

4

Gain insights and enjoy your intelligent infrastructure

The moment you've been waiting for! Armed with insights from your personalized dashboard and reports, you're ready to make informed decisions, seize opportunities, and truly enjoy the power of your data.

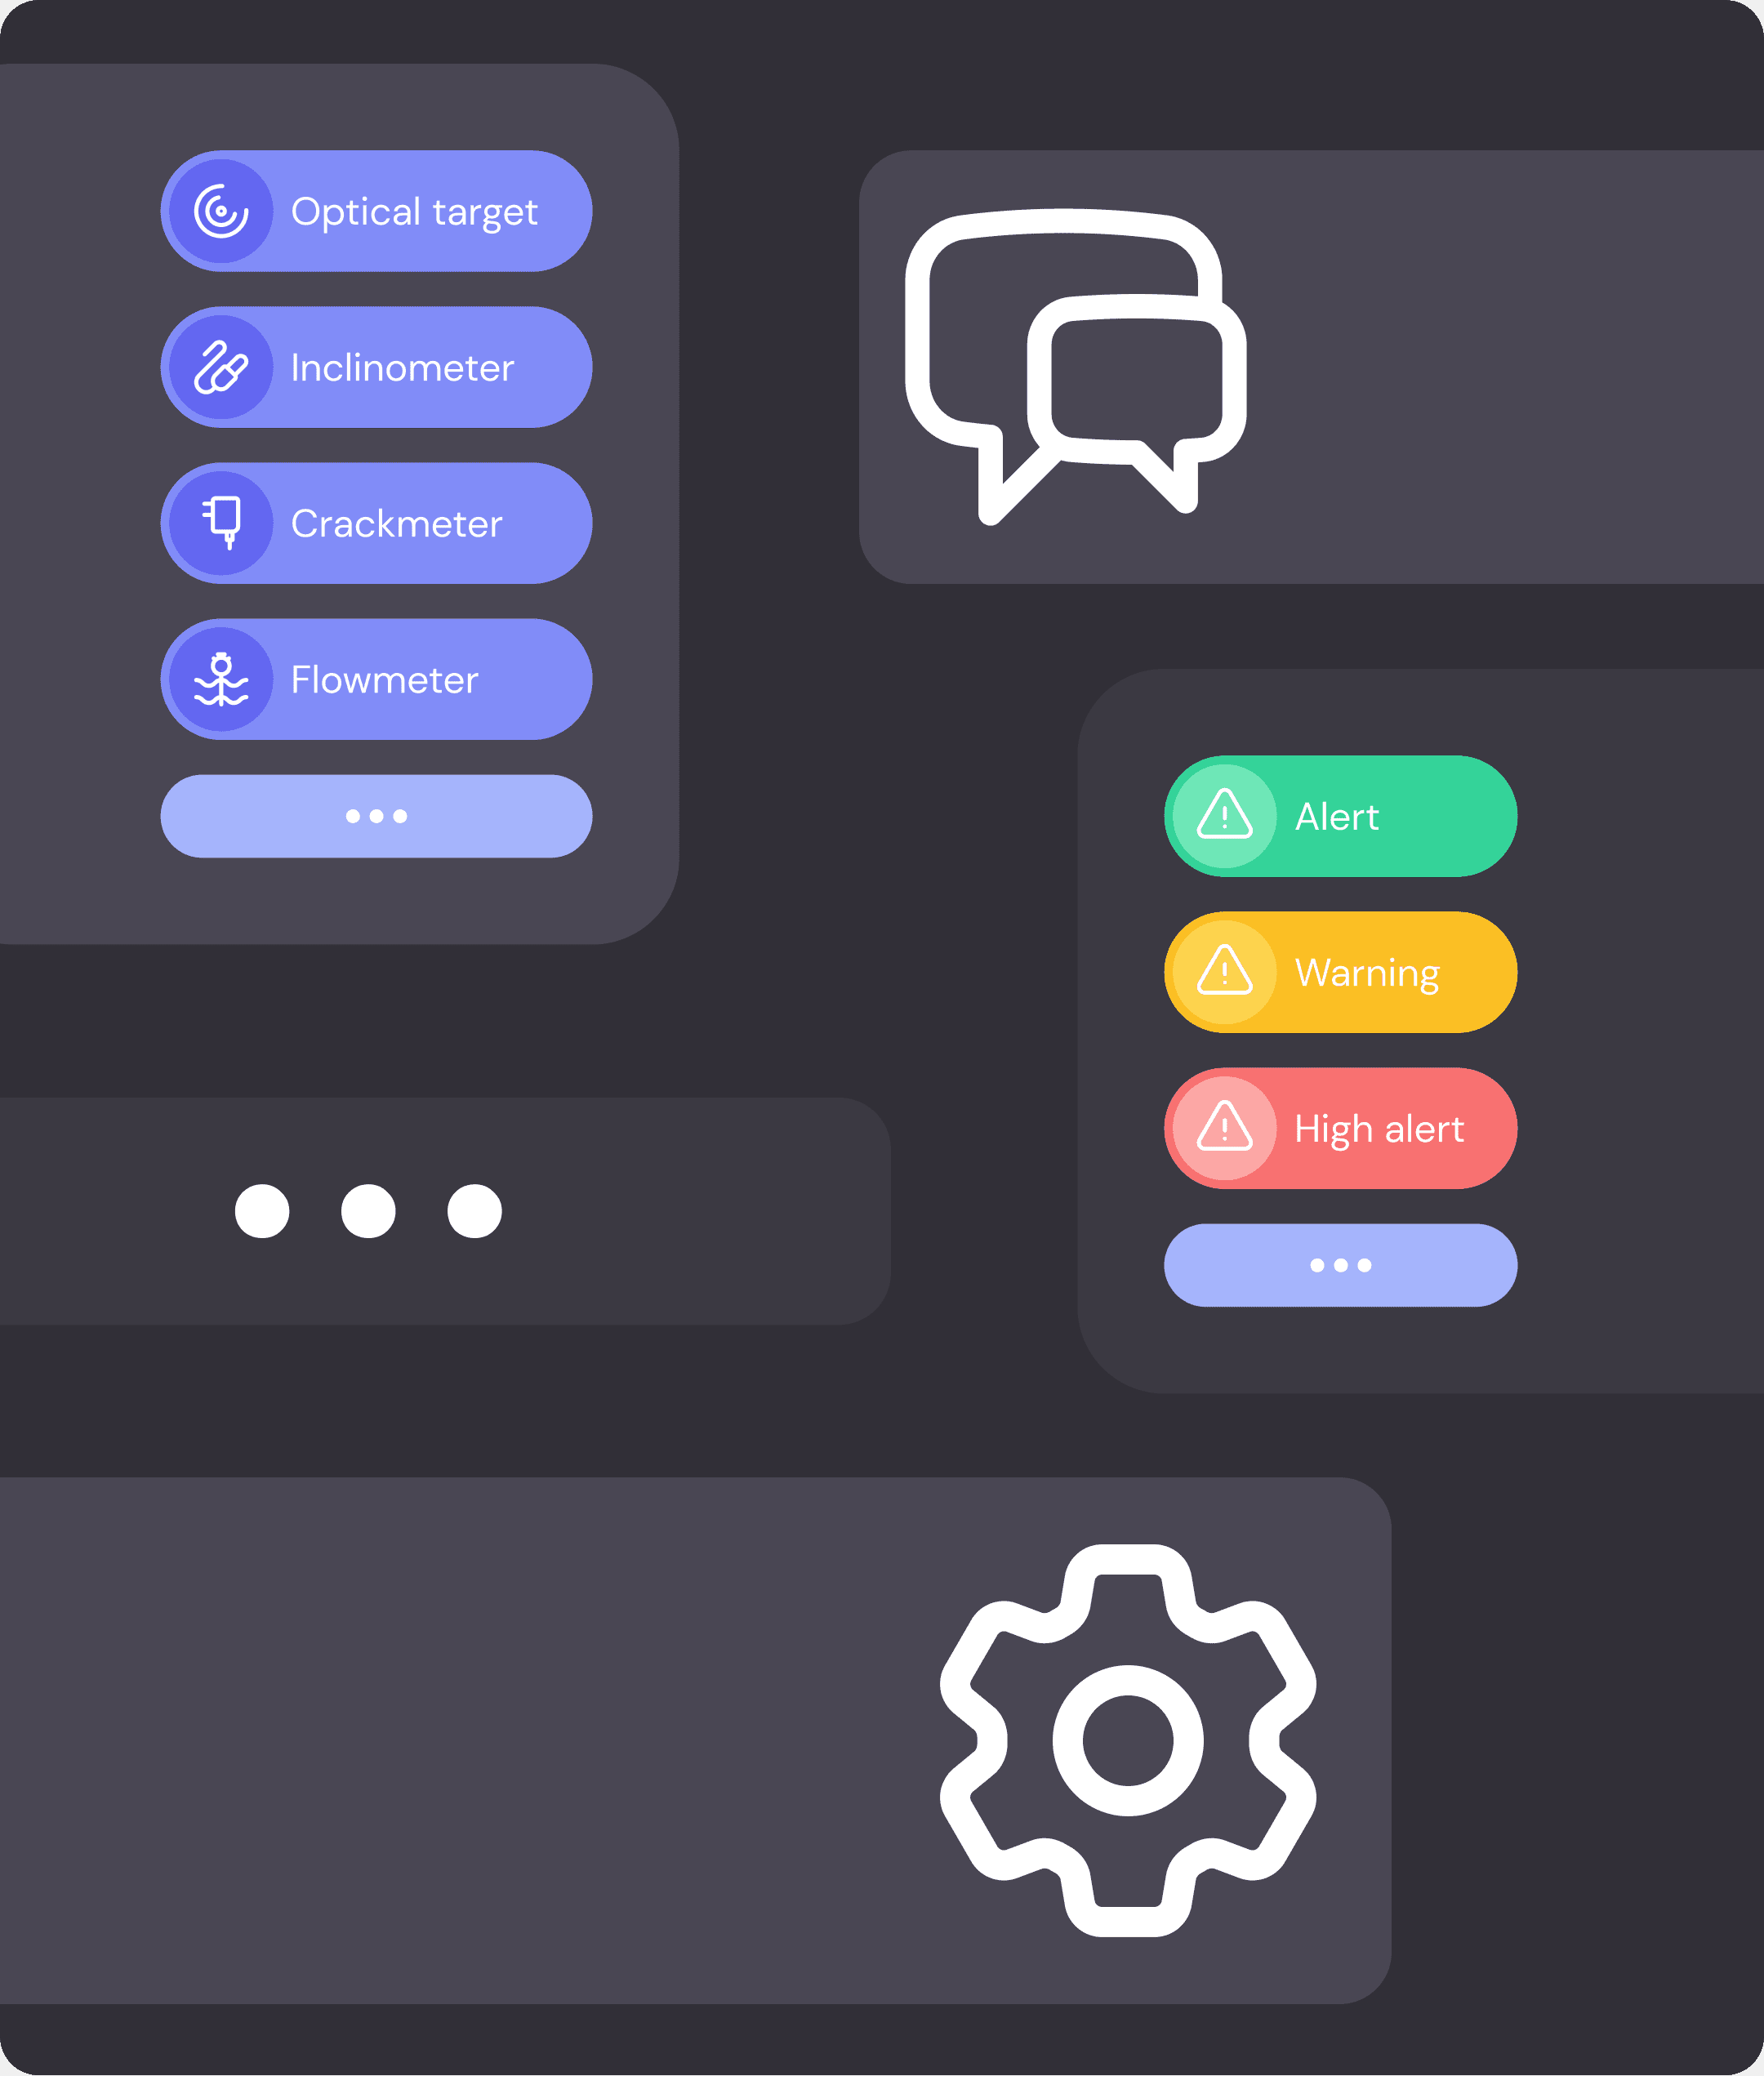
Illustration of a map depicting a secure cropping of the project area
Illustration depicting the configuration of various project parameters, including sensors, alerts, etc.
Illustration signaling that everything is okay, featuring various representative icons and a hand making the 'OK' gesture.

Experience the "New" New with Proqio

Start building faster today

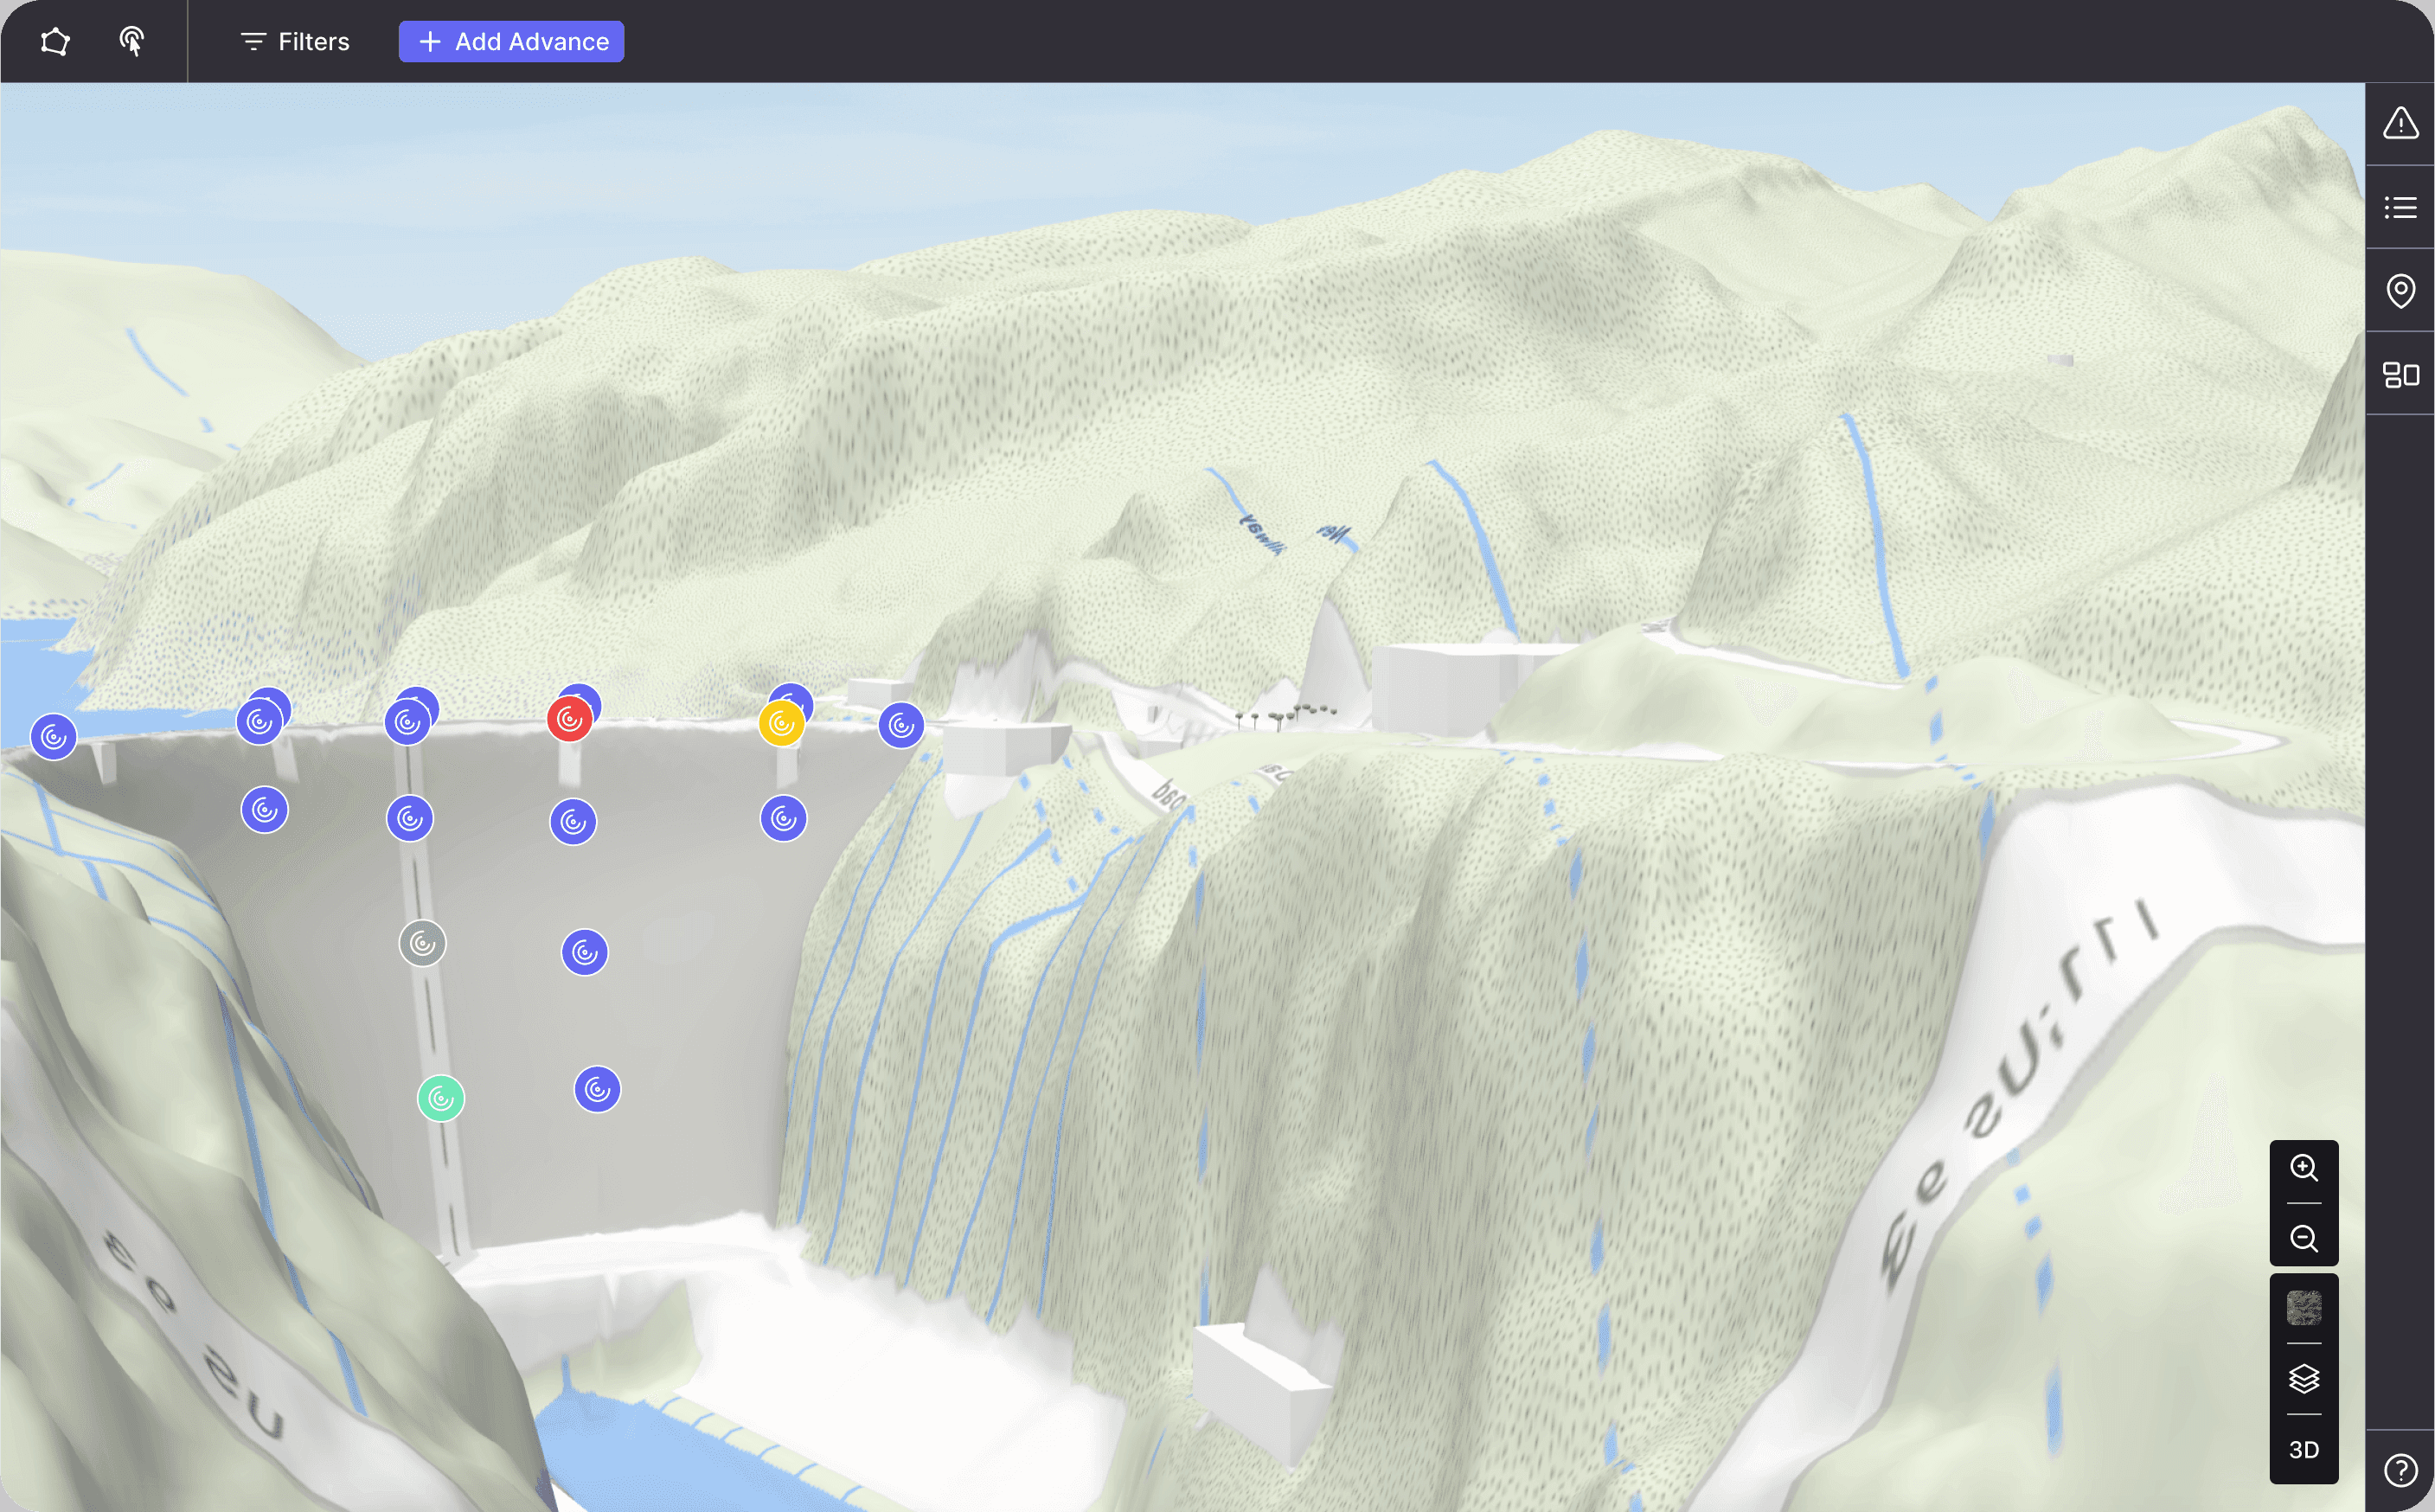
A 3D view of a dam with different sensor and instruments on it.
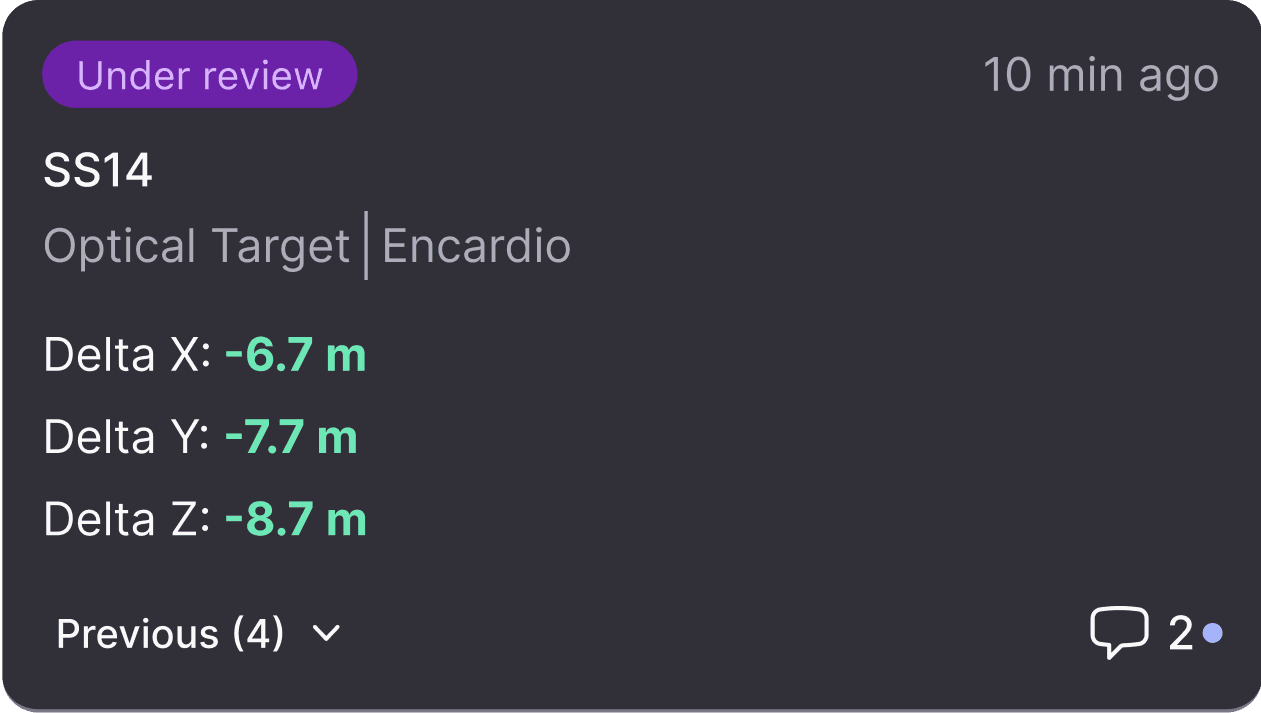
A view of the different alerts

Experience the "New" New with Proqio

Start building faster today

A 3D view of a dam with different sensor and instruments on it.
A view of the different alerts

Experience the "New" New with Proqio

Start building faster today

A 3D view of a dam with different sensor and instruments on it.
A view of the different alerts

Still have more questions? Contact our Help Center.

Still have more questions? Contact our Help Center.