Elevate Your Civil Infrastructure Experience with Proqio
Explore a world of possibilities and unleash the features that transform data into decisions.
Real-time insights with Dashboards
Visualizing Data Dynamically with Your Dashboard
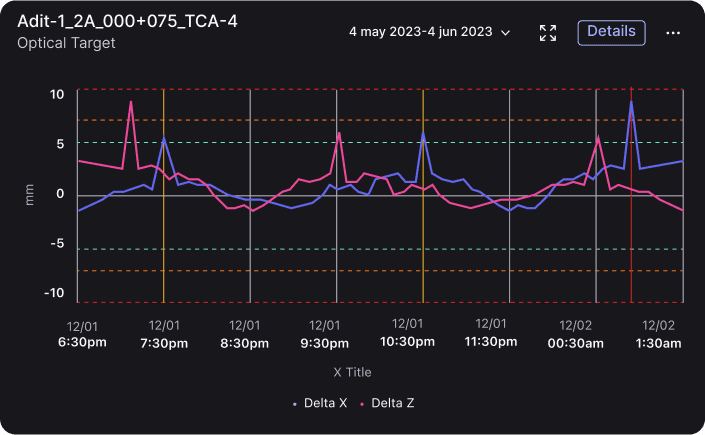
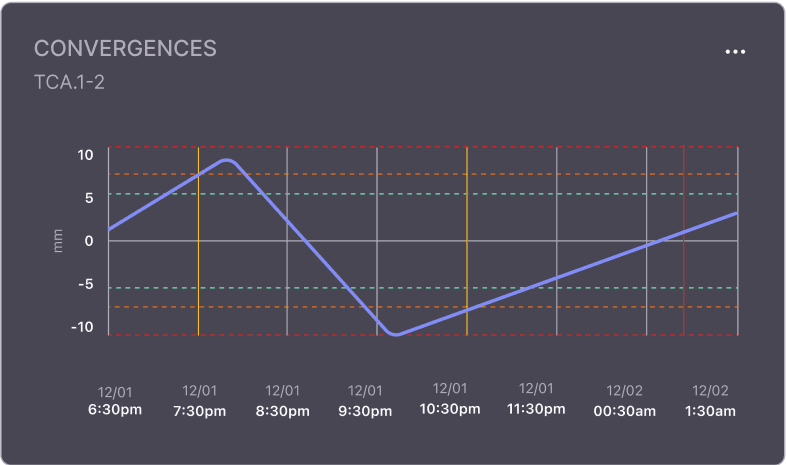
Integrate dynamic chart widgets that directly pull information from sensor data. Visualize trends, patterns, and project metrics with real-time precision.
From Dynamic Dashboards to Timeless Reports
Convert your real-time insights into PDF reports with a single click. Share, present, and archive your data-driven narratives effortlessly.
Craft Your Insights, Your Way
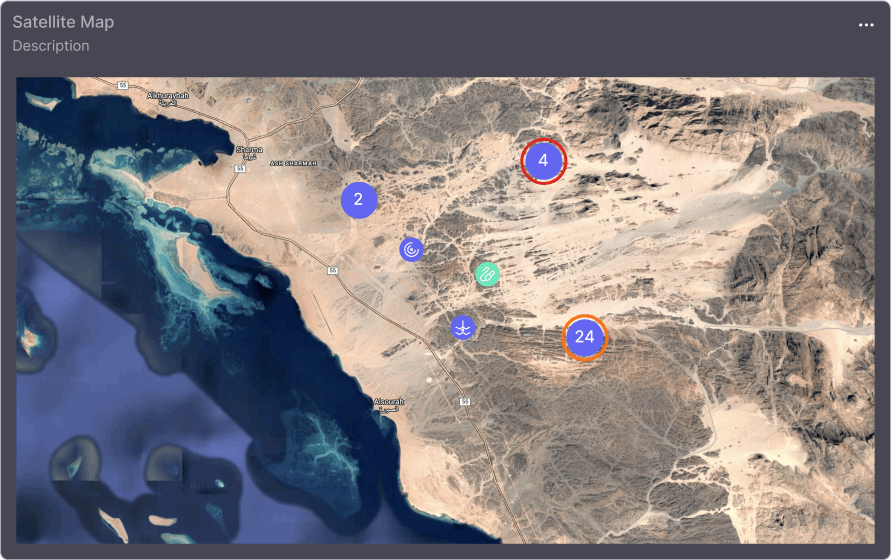
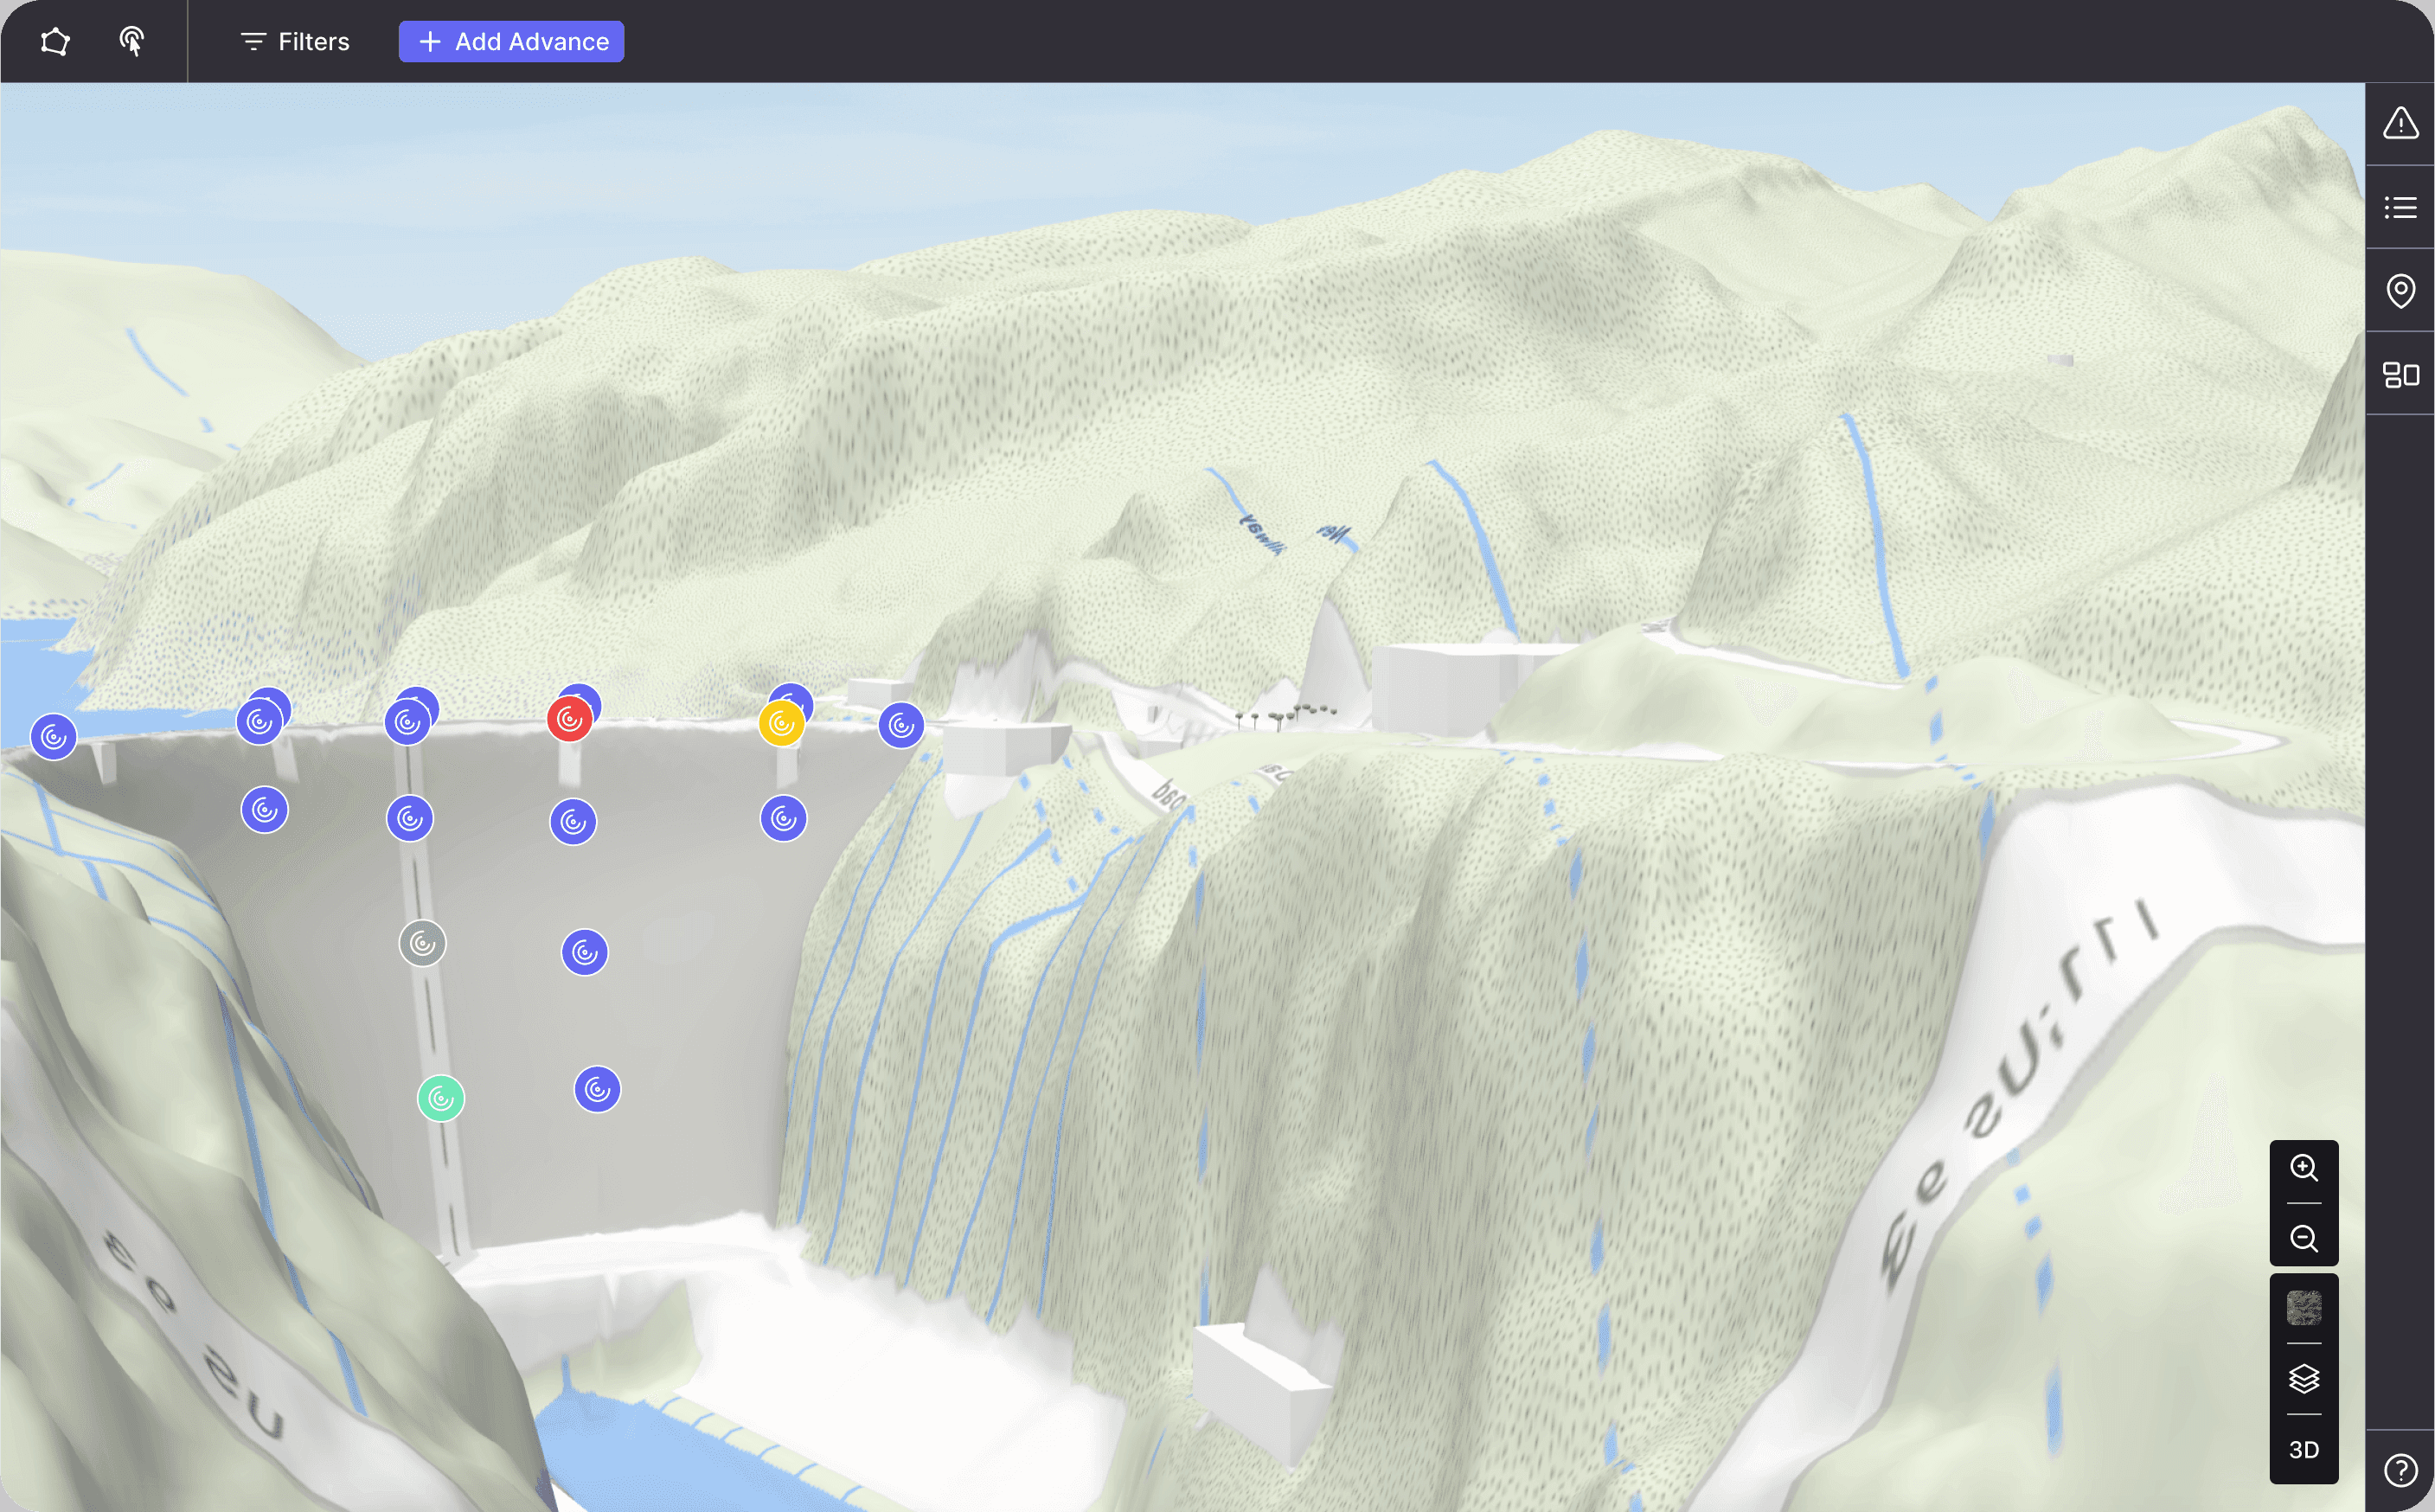
You can customize your experience with a diverse range of widgets. From dynamic charts and live maps to real-time alerts, images, and text – build dashboards that reflect your unique project needs.
Step into the heart of precision with our Monitoring Section
Tailor Your Instrument Landscape
Custom instrument categories.
Personalized models.
Add formulas for precision data representation.
Stay Ahead with Alert Tabs
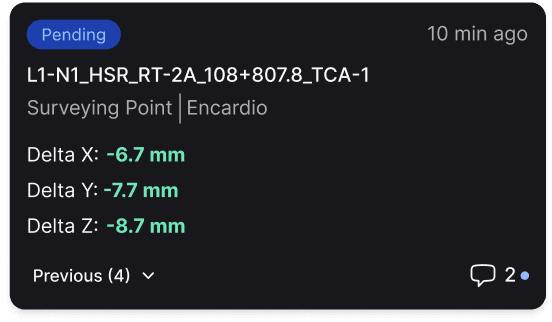
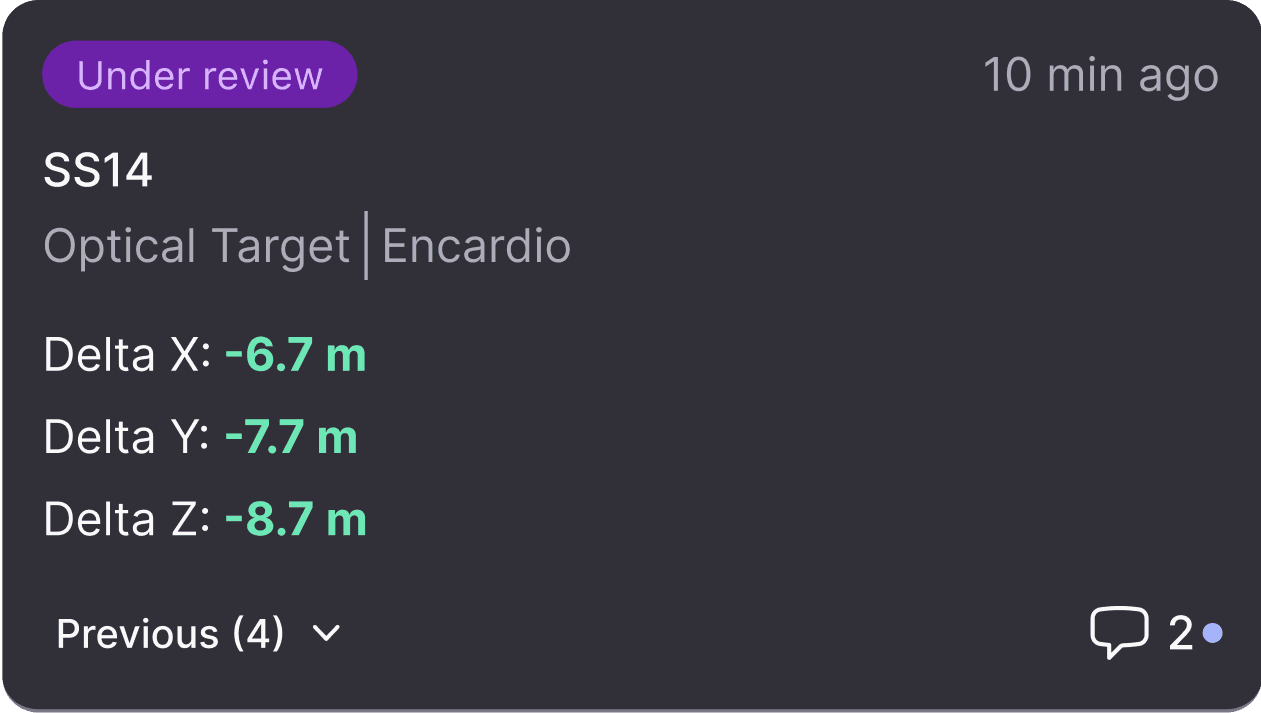
Stay informed in real-time, ensuring immediate response to potential issues and maintaining project integrity.
Precision in Instrument Customization
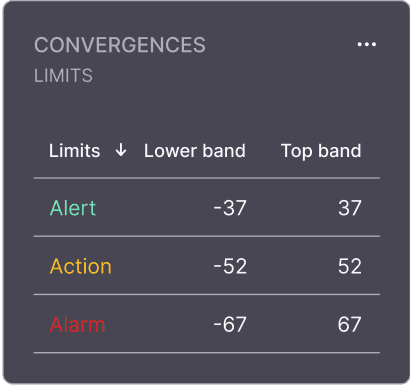
Set custom up and down threshold limits for each instrument. Ensure accuracy by calibrating instruments as needed, guaranteeing precise data collection for informed decision-making.
